Screen Guide
| No. | Name | Description |
|---|---|---|
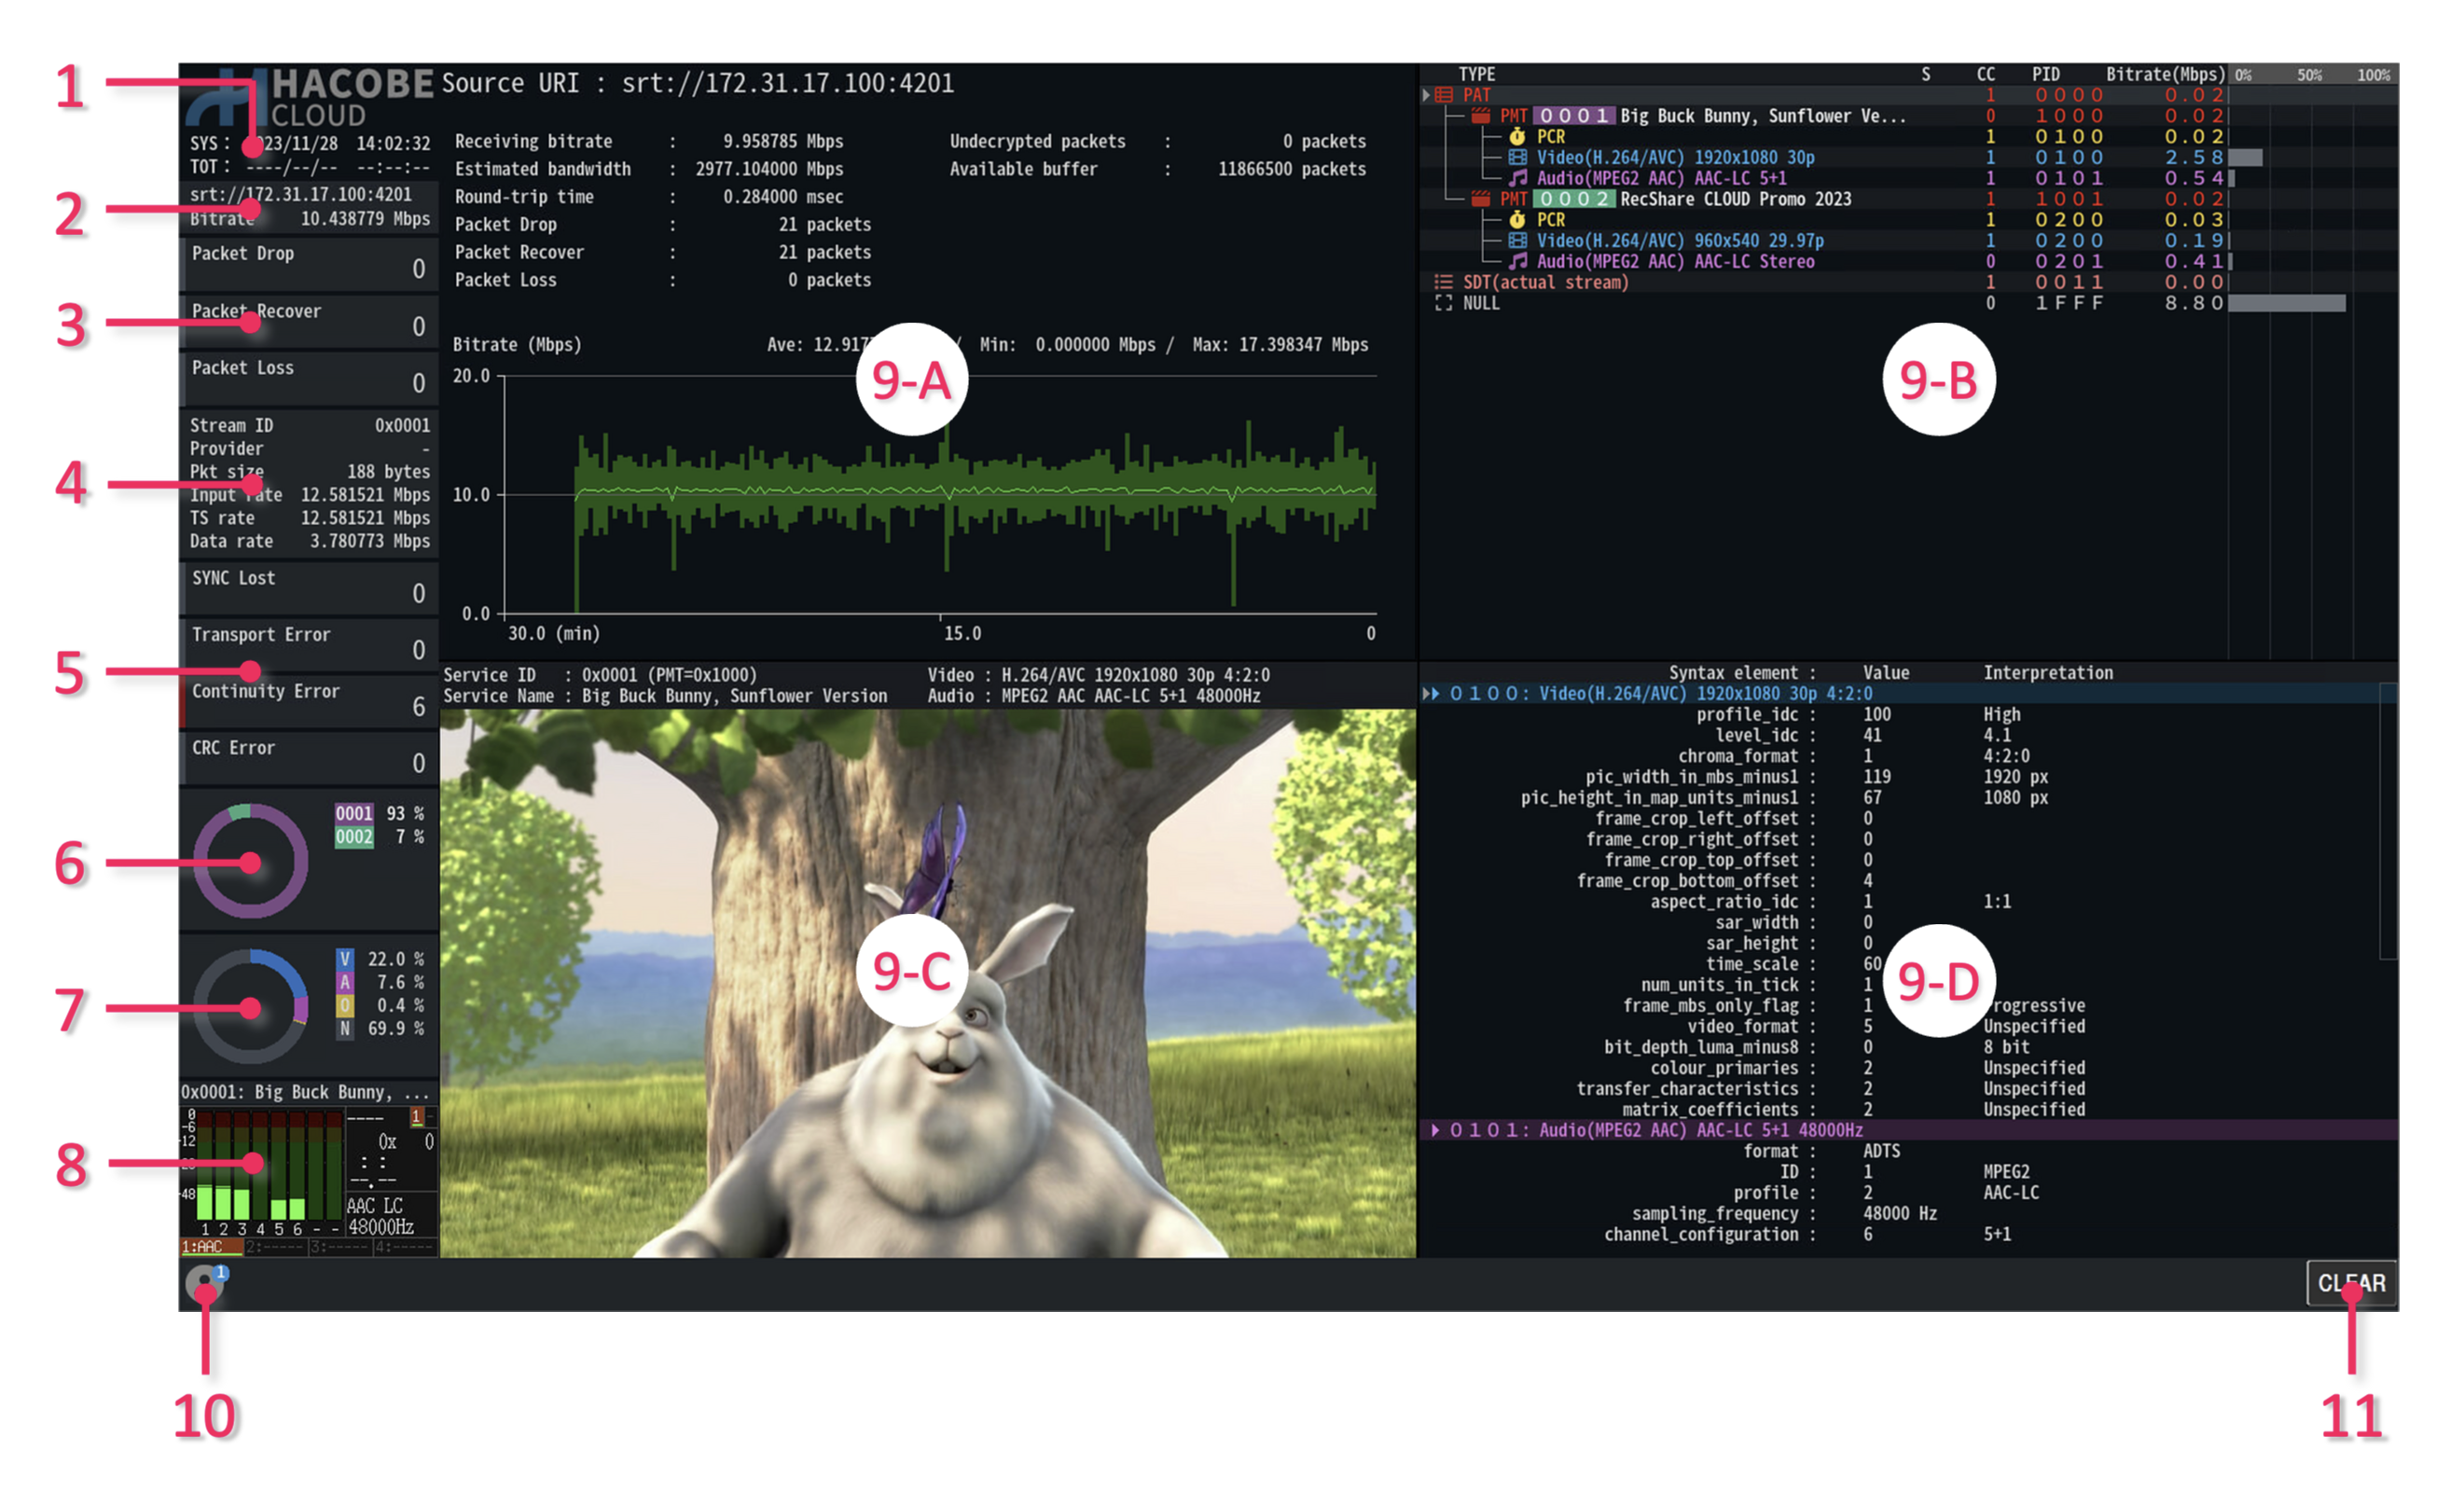
| 1. | Date and Time | Displays system time and TOT/TDT time. System time uses the time according to the time zone setting. |
| 2. | Stream Information | Displays the URI of the stream and the receiving bit rate. |
| 3. | Receiving Error Count | Displays the error count that occurred during the receiving of the stream. |
| 4. | TS Information | Displays summary information about the TS currently being analyzed. |
| 5. | TS Error Count | Displays the number of major TS errors occurring. |
| 6. | Service Occupancy Graph |
Displays the occupancy rate by each service in the stream. The legend indicates the service ID. |
| 7. | Packet Type Occupancy Graph |
Displays the occupancy rate by packet type. The legend indicates the below. V: Video Packet, A: Audio Packet, S: SI/PSI, N: Null Packet, O: Others |
| 8. | Audio Level Meter | Displays the level of decoded audio. |
| 9. | Analysis Display | Displays analysis information. Four different analysis modes can be combined for display. |
| 10. | Online User Indicator | Displays the number of users currently accessing the system. |
| 11. | Clear Button | Clears the analysis data. Error counts, etc. are initialized. |