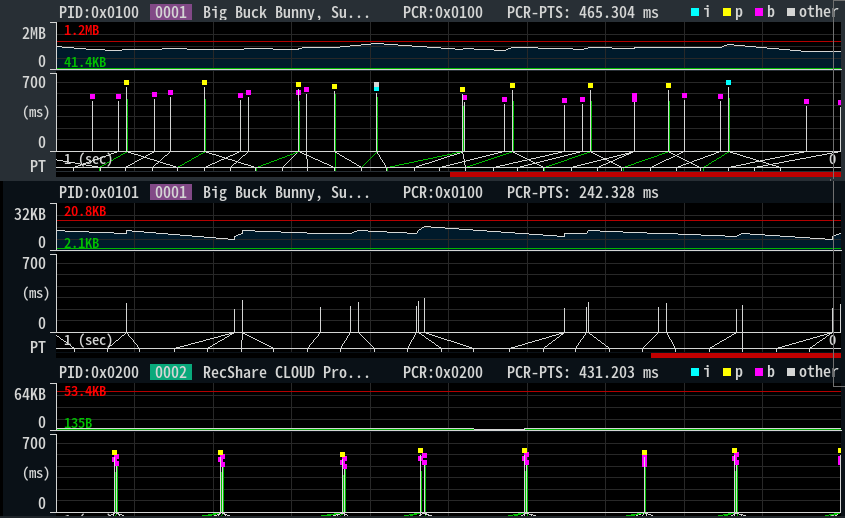
PTS Graph
Display a graph showing the relationship between PTS values and PCR values for video and audio data.
Screen Items
| Item | Description |
|---|---|
| PID | Display the PID of the packet with PTS that is being analyzed. |
| PCR | Display the PID of the PCR packet. |
| PTS-PCR | Display the average of the difference between the PCR value and the PTS value at the time of PTS reception. |
| Graph Area |
|
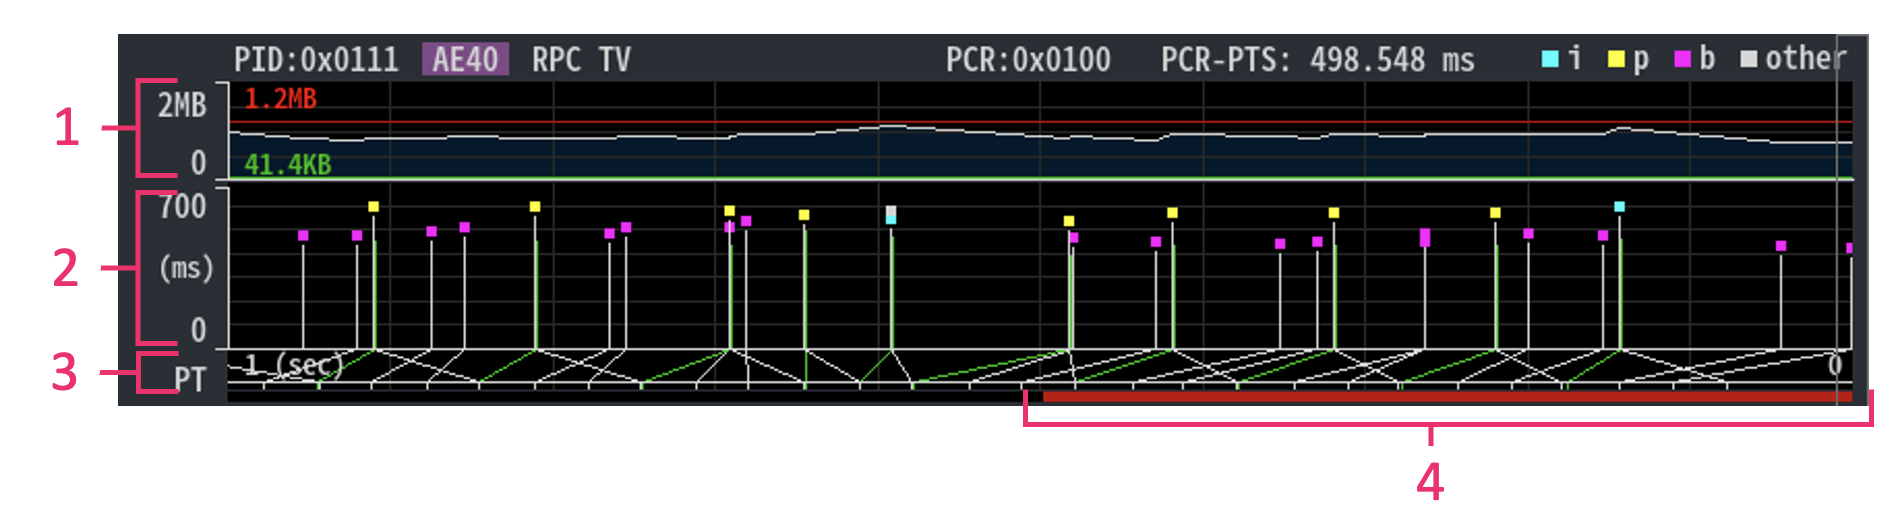
Graph Area Details
| Item | Description |
|---|---|
| 1. PES data volume | Display the transition graph of the volume of PES data held in the program.
|
| 2. PTS-PCR difference | The horizontal axis indicates the time the frame was received. The vertical axis shows the difference between the PTS(DTS) and PCR values of the received frame. Frame type is indicated by a colored dot.
|
| 3. Frame Timing | Display the relationship between the received time of the frame data and the displayed time in the figure below.
|
| 4. Average value of PTS-PCR difference | Displays the average of the difference values between the PTS and PCR values as a bar graph. Longer red bars mean longer time between frame reception and display. |
Operation
| Function | Description |
|---|---|
| V-axis adjust | Change the PTS-PCR display scale. |
| H-axis adjust | Change the time scale. |
| Format Select | Switch the frame type display. |